In this article we will see exercises in which we will create the frequency table for a given data set.
During the month of January, the following maximum temperatures were recorded in a city:
Create the frequency table, it should have each data value, its absolute frequencies, cumulative frequencies, relative frequencies, and cumulative relative frequencies.
1 In the first column of the table we place the variable ordered from smallest to largest.
2 In the second we write the absolute frequency (how many times each specific data value appears),  .
.
3 In the third we write the cumulative frequency (the sum of the absolute frequencies of the current variable and the previous ones),  .
.
4 In the first row we have that the absolute frequency and the cumulative frequency are equal: 
5 For all rows that are not the first, we have that the cumulative frequency equals the absolute frequency of this row plus the cumulative frequency of the previous row, thus 
6 The last cumulative frequency must equal  (sum of ), that is,
  .
.
7 In the fourth column we have the relative frequencies,  which are the result of dividing each absolute frequency by the total number of data values,
  .
.
8 In the fifth we write the cumulative relative frequency  .
.
9 In the first row we have that the cumulative relative frequency and the relative frequency are equal: 
10 For all rows that are not the first, we have that the cumulative relative frequency equals the relative frequency of this row plus the cumulative relative frequency of the previous row, thus 
Having said all of the above, the frequency table is given by
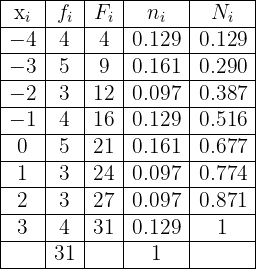
During winter, the following minimum temperatures were recorded in Fahrenheit in New York City: 
Create the frequency table, it should have each data value, its absolute frequencies, cumulative frequencies, relative frequencies, and cumulative relative frequencies.
Notice that we have the following characteristics
1 In the first column of the table we place the variable ordered from smallest to largest.
2 In the second we write the absolute frequency (how many times each specific data value appears), .
3 In the third we write the cumulative frequency (the sum of the absolute frequencies of the current variable and the previous ones), .
4 In the first row we have that the absolute frequency and the cumulative frequency are equal:
5 For all rows that are not the first, we have that the cumulative frequency equals the absolute frequency of this row plus the cumulative frequency of the previous row, thus
6 The last cumulative frequency must equal (sum of ), that is, .
7 In the fourth column we have the relative frequencies, which are the result of dividing each absolute frequency by the total number of data values, .
8 In the fifth we write the cumulative relative frequency .
9 In the first row we have that the cumulative relative frequency and the relative frequency are equal:
10 For all rows that are not the first, we have that the cumulative relative frequency equals the relative frequency of this row plus the cumulative relative frequency of the previous row, thus
Having said all of the above, the frequency table is given by
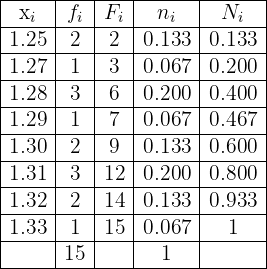
A trader obtained the following closing prices at one-minute intervals for a cryptocurrency: 
Create the frequency table, it should have each data value, its absolute frequencies, cumulative frequencies, relative frequencies, and cumulative relative frequencies.
Notice that we have the following characteristics
1 In the first column of the table we place the variable ordered from smallest to largest.
2 In the second we write the absolute frequency (how many times each specific data value appears), .
3 In the third we write the cumulative frequency (the sum of the absolute frequencies of the current variable and the previous ones), .
4 In the first row we have that the absolute frequency and the cumulative frequency are equal:
5 For all rows that are not the first, we have that the cumulative frequency equals the absolute frequency of this row plus the cumulative frequency of the previous row, thus
6 The last cumulative frequency must equal (sum of ), that is,  .
.
7 In the fourth column we have the relative frequencies, which are the result of dividing each absolute frequency by the total number of data values,  .
.
8 In the fifth we write the cumulative relative frequency .
9 In the first row we have that the cumulative relative frequency and the relative frequency are equal:
10 For all rows that are not the first, we have that the cumulative relative frequency equals the relative frequency of this row plus the cumulative relative frequency of the previous row, thus
Having said all of the above, the frequency table is given by
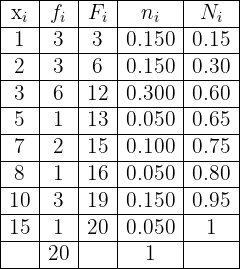
The number of hours of study for a group of students prior to a mathematics exam are: 
Create the frequency table, it should have each data value, its absolute frequencies, cumulative frequencies, relative frequencies, and cumulative relative frequencies.
Notice that we have the following characteristics
1 In the first column of the table we place the variable ordered from smallest to largest.
2 In the second we write the absolute frequency (how many times each specific data value appears), .
3 In the third we write the cumulative frequency (the sum of the absolute frequencies of the current variable and the previous ones), .
4 In the first row we have that the absolute frequency and the cumulative frequency are equal:
5 For all rows that are not the first, we have that the cumulative frequency equals the absolute frequency of this row plus the cumulative frequency of the previous row, thus
6 The last cumulative frequency must equal (sum of ), that is,  .
.
7 In the fourth column we have the relative frequencies, which are the result of dividing each absolute frequency by the total number of data values,  .
.
8 In the fifth we write the cumulative relative frequency .
9 In the first row we have that the cumulative relative frequency and the relative frequency are equal:
10 For all rows that are not the first, we have that the cumulative relative frequency equals the relative frequency of this row plus the cumulative relative frequency of the previous row, thus
Having said all of the above, the frequency table is given by
The age of a group of people are: 
Create the frequency table, it should have each data value, its absolute frequencies, cumulative frequencies, relative frequencies, and cumulative relative frequencies.
Notice that we have the following characteristics
1 In the first column of the table we place the variable ordered from smallest to largest.
2 In the second we write the absolute frequency (how many times each specific data value appears), .
3 In the third we write the cumulative frequency (the sum of the absolute frequencies of the current variable and the previous ones), .
4 In the first row we have that the absolute frequency and the cumulative frequency are equal:
5 For all rows that are not the first, we have that the cumulative frequency equals the absolute frequency of this row plus the cumulative frequency of the previous row, thus
6 The last cumulative frequency must equal (sum of ), that is, .
7 In the fourth column we have the relative frequencies, which are the result of dividing each absolute frequency by the total number of data values, .
8 In the fifth we write the cumulative relative frequency .
9 In the first row we have that the cumulative relative frequency and the relative frequency are equal:
10 For all rows that are not the first, we have that the cumulative relative frequency equals the relative frequency of this row plus the cumulative relative frequency of the previous row, thus
Having said all of the above, the frequency table is given by
The weights of the  people are given by the following table
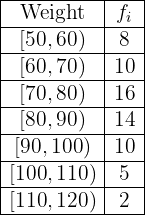
Create its respective frequency table.
Notice that the frequency table must satisfy the following
1 In the first column of the table we place the intervals or groups. We already have this column.
2 In the second we write the absolute frequency (how many times each specific data value appears), . We already have this column.
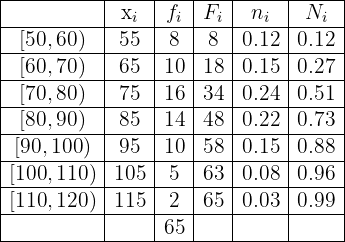
3 In the third we write the cumulative frequency (the sum of the absolute frequencies of the current variable and the previous ones), .
4 In the first row we have that the absolute frequency and the cumulative frequency are equal:
5 For all rows that are not the first, we have that the cumulative frequency equals the absolute frequency of this row plus the cumulative frequency of the previous row, thus
6 The last cumulative frequency must equal (sum of ), that is,  .
.
7 In the fourth column we have the relative frequencies, which are the result of dividing each absolute frequency by the total number of data values,  .
.
8 In the fifth we write the cumulative relative frequency .
9 In the first row we have that the cumulative relative frequency and the relative frequency are equal:
10 For all rows that are not the first, we have that the cumulative relative frequency equals the relative frequency of this row plus the cumulative relative frequency of the previous row, thus
Having said all of the above, the table is given by
The heights (in cm) of  students are given by the following table
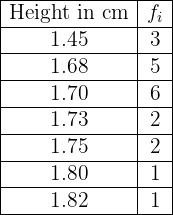
Create your respective frequency table.
Notice that the frequency table must satisfy the following
1 In the first column of the table we place the intervals or groups. We already have this column.
2 In the second we write the absolute frequency (how many times each specific data value appears), . We already have this column.
3 In the third we write the cumulative frequency (the sum of the absolute frequencies of the current variable and the previous ones), .
4 In the first row we have that the absolute frequency and the cumulative frequency are equal:
5 For all rows that are not the first, we have that the cumulative frequency equals the absolute frequency of this row plus the cumulative frequency of the previous row, thus
6 The last cumulative frequency must equal (sum of ), that is,  .
.
7 In the fourth column we have the relative frequencies, which are the result of dividing each absolute frequency by the total number of data values, .
8 In the fifth we write the cumulative relative frequency .
9 In the first row we have that the cumulative relative frequency and the relative frequency are equal:
10 For all rows that are not the first, we have that the cumulative relative frequency equals the relative frequency of this row plus the cumulative relative frequency of the previous row, thus
Having said all of the above, the table is given by
A teacher observes the grades of  children from a certain school. The information obtained appears summarized in the following table:
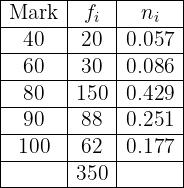
Complete the table by obtaining the values  .
.
We have that the sum of all relative frequencies is always equal to  . This means that
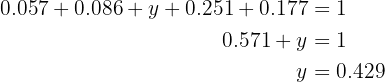
Therefore  . Now, we have that
  is the relative frequency of the group with grade
  , while the absolute frequency is
  . Also, notice that
  since this is data from children. Thus, we have that the relative frequency is the absolute frequency divided by , we will use this fact to find
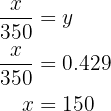
Now we have the necessary data to complete our table
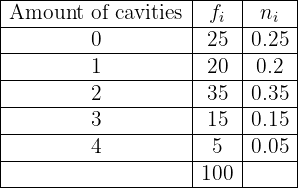
A dentist observes the number of cavities in each of the  children from a certain school. The information obtained appears summarized in the following table:
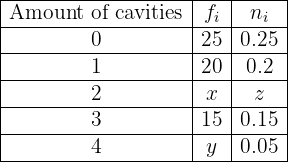
Complete the table by obtaining the values  .
.
We have that the sum of all relative frequencies is always equal to . This means that
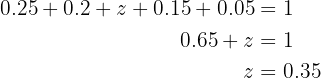
Therefore  . Now, we have that
  is the relative frequency of the group with
  cavities, while the absolute frequency is . Also, notice that
  since this is data from children. Thus, we have that the relative frequency is the absolute frequency divided by , we will use this fact to find
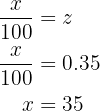
We only need to find which is the absolute frequency of the group with  cavities, while its relative frequency is
  . We have that the relative frequency is the absolute frequency divided by , we will use this fact to find
Now we have the necessary data to complete our table
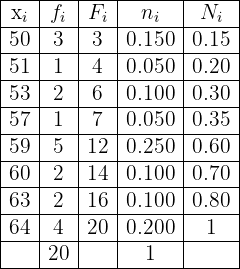
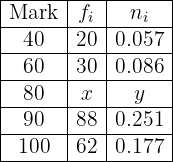
Complete the missing data in the following statistical table:
We will solve this step by step. First we will find the value of and then we will find all the missing data for each row.
1 We find the value of  , which is obtained from the last row of the cumulative frequency.
2 First row. It's simple, we only need the cumulative frequency,  , but being the first row (first class), this equals the absolute frequency, therefore,

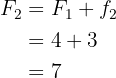
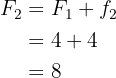
3 Second row. First let's find the cumulative frequency, remember that it equals
Now let's find the relative frequency. Since we already have the absolute frequency we have

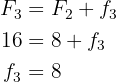
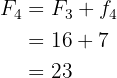
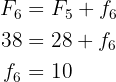
4 Seventh row. We only need the absolute frequency, we can obtain this through the cumulative frequency or the relative frequency, we will proceed through the cumulative frequency
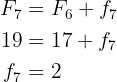
5 Eighth row. We only need the absolute frequency, we will calculate it directly
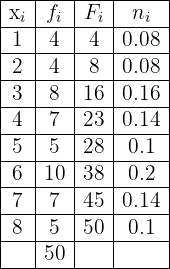
Thus, the table is given by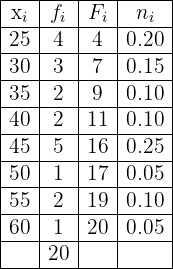
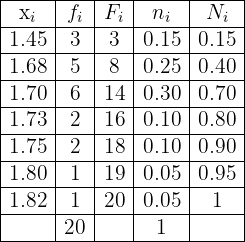
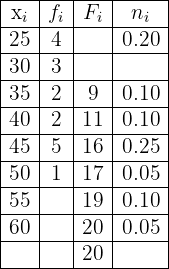
Complete the missing data in the following statistical table:
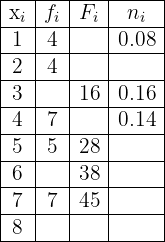
We will solve this step by step. First we will find the value of and then we will find all the missing data for each row.
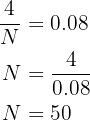
1 First let's find the value of .
To find the value of we will use the first row. Remember that the relative frequency is the absolute frequency divided by . Since we have the absolute frequency  and the relative frequency
  , we will use this to solve for
2 First row. It's simple, we only need the cumulative frequency, , but being the first row (first class), this equals the absolute frequency, therefore,
3 Second row. First let's find the cumulative frequency, remember that it equals
Now let's find the relative frequency. Since we already have the absolute frequency we have

4 Third row. We only need the absolute frequency, we can obtain this through the cumulative frequency or the relative frequency, we will proceed through the cumulative frequency
5 Fourth row. We only need the cumulative frequency, we will calculate it directly
6 Fifth row. We only need the relative frequency, we will calculate it directly

7 Sixth row. We need the absolute frequency and the relative frequency. Let's calculate the absolute frequency through the cumulative frequency.
Now let's calculate the relative frequency directly using the absolute frequency

8 Seventh row. We only need the relative frequency, we will calculate it directly

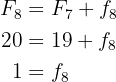
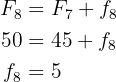
9 Eighth and last row. We are missing all the data. First let's obtain the cumulative frequency. Notice that since it is the last row, the cumulative frequency equals , therefore

Now let's obtain the absolute frequency through the cumulative frequency
Finally let's obtain the relative frequency directly

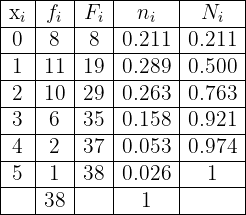
Thus, the table is given by
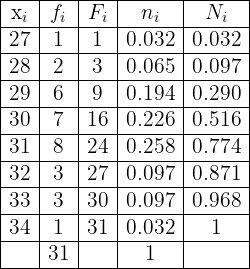
During a soccer championship consisting of 38 matches, a team scored the following goals:
Create the frequency table, it should have each data value, its absolute frequencies, cumulative frequencies, relative frequencies, and cumulative relative frequencies.
Notice that we have the following characteristics
1 In the first column of the table we place the variable ordered from smallest to largest.
2 In the second we write the absolute frequency (how many times each specific data value appears), .
3 In the third we write the cumulative frequency (the sum of the absolute frequencies of the current variable and the previous ones), .
4 In the first row we have that the absolute frequency and the cumulative frequency are equal:
5 For all rows that are not the first, we have that the cumulative frequency equals the absolute frequency of this row plus the cumulative frequency of the previous row, thus
6 The last cumulative frequency must equal (sum of ), that is,  .
.
7 In the fourth column we have the relative frequencies, which are the result of dividing each absolute frequency by the total number of data values, 
8 In the fifth we write the cumulative relative frequency .
9 In the first row we have that the cumulative relative frequency and the relative frequency are equal:
10 For all rows that are not the first, we have that the cumulative relative frequency equals the relative frequency of this row plus the cumulative relative frequency of the previous row, thus
Having said all of the above, the frequency table is given by
The audience (in millions of people) of a TV series during the 22 episodes of its first season is shown in the following table.
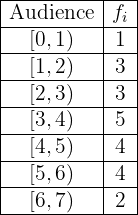
Create its corresponding frequency table.
1 In the first column of the table we place the intervals or groups. We already have this column.
2 In the second column we write the absolute frequency (how many times each specific data value appears), . We already have this column.
3 In the third column we write the cumulative frequency (the sum of the absolute frequencies of the current variable and the previous ones), .
4 In the first row we have that the absolute and cumulative frequency are the same: .
5 For all rows that are not the first, the cumulative frequency is equal to the absolute frequency of that row plus the cumulative frequency of the previous row, that is, .
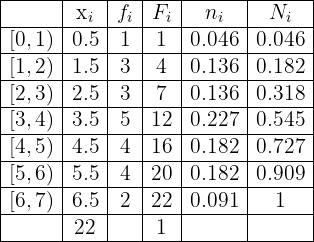
6 The last cumulative frequency must be equal to (the sum of all ), that is,  .
.
7 In the fourth column we place the relative frequencies, , which are the result of dividing each absolute frequency by the total number of data points,  .
.
8 In the fifth column we write the cumulative relative frequency, .
9 In the first row we have that the cumulative relative frequency and the relative frequency are the same: .
10 For all rows that are not the first, the cumulative relative frequency is equal to the relative frequency of that row plus the cumulative relative frequency of the previous row, that is, .
Said all of the above, the table is given by:
The grades of the  students who took a math class in Chicago last year are:
Create the frequency table, it should have each data value, its absolute frequencies, cumulative frequencies, relative frequencies, and cumulative relative frequencies.
Notice that we have the following characteristics
1 In the first column of the table we place the variable ordered from smallest to largest.
2 In the second we write the absolute frequency (how many times each specific data value appears), .
3 In the third we write the cumulative frequency (the sum of the absolute frequencies of the current variable and the previous ones), .
4 In the first row we have that the absolute frequency and the cumulative frequency are equal:
5 For all rows that are not the first, we have that the cumulative frequency equals the absolute frequency of this row plus the cumulative frequency of the previous row, thus
6 The last cumulative frequency must equal (sum of ), that is,  .
.
7 In the fourth column we have the relative frequencies, which are the result of dividing each absolute frequency by the total number of data values, 
8 In the fifth we write the cumulative relative frequency .
9 In the first row we have that the cumulative relative frequency and the relative frequency are equal:
10 For all rows that are not the first, we have that the cumulative relative frequency equals the relative frequency of this row plus the cumulative relative frequency of the previous row, thus
Having said all of the above, the frequency table is given by

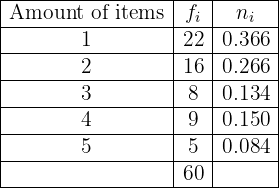
In a department store, the number of items that each of its last  customers bought was recorded. This information is summarized in the following table:
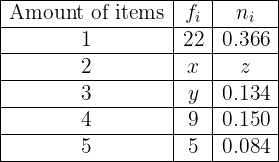
Complete the table by obtaining the values .
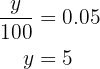
We have that the sum of all relative frequencies is always equal to . This means that
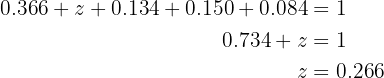
Therefore  . Now, we have that is the relative frequency of the group that bought items, while the absolute frequency is . Also, notice that
  since this is data from customers. Thus, we have that the relative frequency is the absolute frequency divided by , we will use this fact to find
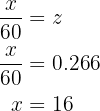
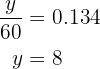
We only need to find which is the absolute frequency of the group that bought  items, while its relative frequency is
  . We have that the relative frequency is the absolute frequency divided by , we will use this fact to find
Now we have the necessary data to complete our table
Summarize with AI:
Did you like this article? Rate it!