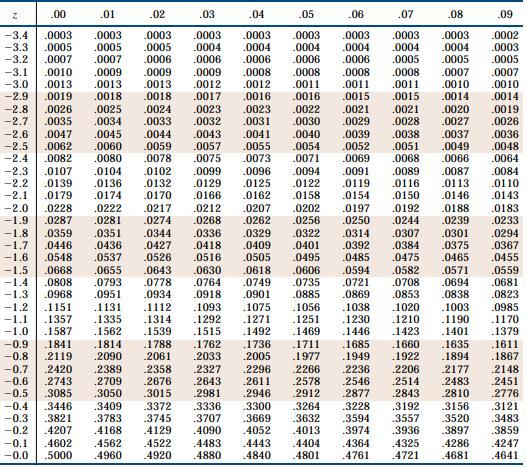
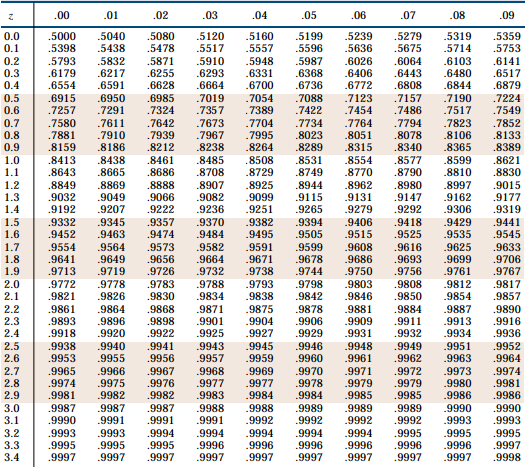
Normal Distribution Table
The normal distribution table is used to locate defined values for the variable z.
We can help you find the best elementary math classes so you understand everything from the beginning.
Normal Distribution Exercises
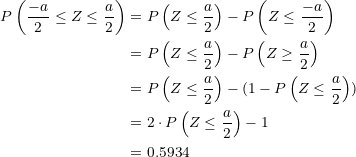
If  is a random variable from a distribution
  , find:
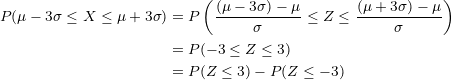
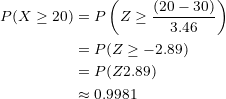
In this case, we are working with a standard normal distribution. To solve it we will use the following formula:

Now, we need to locate in our normal distribution table the value when 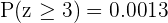 , but we need the value for when
  , so we use
 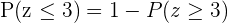 , then we obtain
  . Additionally, since the normal distribution is symmetric, we have
  .
.
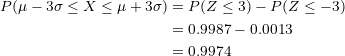
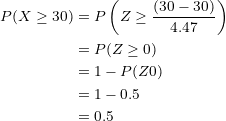
That is, approximately  of the values of are within three standard deviations of the mean.
In a normal distribution with mean  and standard deviation
  , calculate the value of a such that:
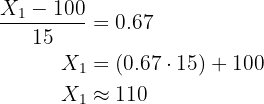
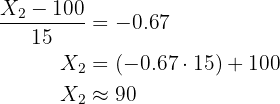
Using the formula 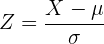 , we will substitute the value of the mean (
 ) and the standard deviation (
 ).
).
Simplifying, we obtain:
From which it follows that:

Now we locate in the normal distribution table the value  and observe that it corresponds to
  , then:

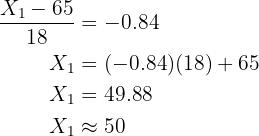
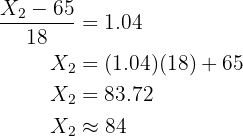
In a city, it is estimated that the maximum temperature in June follows a normal distribution, with mean  and standard deviation
  . Calculate the number of days in the month when maximum temperatures between
  and
and  are expected.
Using the formula , we will substitute the value of the mean ( ) and the standard deviation (
 ).
).
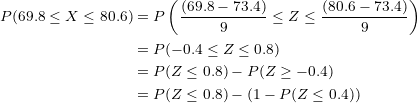
We look up the corresponding values in the normal distribution table:

Therefore:
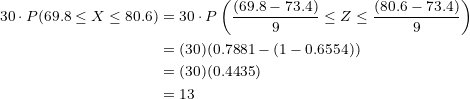
This means that in the entire month, only  days will reach temperatures between
  and
and  degrees Fahrenheit.
The mean weight of  students at a school is
  and the standard deviation is
  .
.
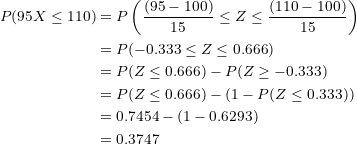
Assuming that weights are normally distributed, find how many students weigh:
1. Between  and
and  .
.
2. More than  .
.
3. Less than  .
.
4. .
5. or less.
1. Between and .
Substituting:
Locating the values in the normal distribution table and operating:

Therefore, if we multiply the probability 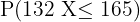 by the students:
Of the students,  weigh between
  and
and  pounds.
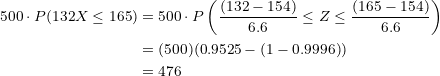
2. More than .
Substituting and simplifying:
Multiplying the probability by :

It is impossible to find a single student weighing more than  pounds.
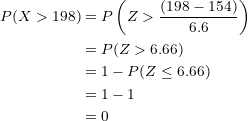
3. Less than .
Substituting and simplifying:
Multiplying the probability by :

There are  students who weigh less than
  pounds.
4. .
When the distribution is continuous, the probability that the variable has an exact value is always zero ( ). Therefore:
5. or less.
Given the previous results:
There are zero students who weigh exactly pounds and there are students who weigh less than pounds, so there are students who weigh pounds or less.

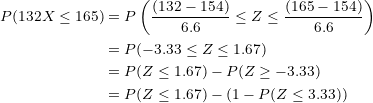
Suppose that exam results follow a normal distribution with mean  and standard deviation
  . Find:
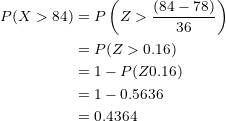
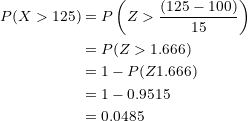
1. What is the probability that a person taking the exam obtains a grade higher than  ?
?
2. Calculate the proportion of students who have scores that exceed by at least five points the score that marks the boundary between Pass and Fail (the  of students who obtained the lowest scores are declared Fail).
3. If it is known that a student's grade is greater than , what is the probability that their grade is, in fact, greater than  ?
?
1. What is the probability that a person taking the exam obtains a grade higher than ?
We substitute the values in the formula:
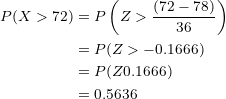
The probability that a person obtains a score greater than on the exam is  .
.
2. Calculate the proportion of students who have scores that exceed by at least five points the score that marks the boundary between Pass and Fail (the of students who obtained the lowest scores are declared Fail).
Substituting values in the formula:

We locate the probability  in the normal distribution table, which is
  , this means:
We solve for  :
:

We calculate for  :
:

The percentage of students who Pass and whose score is  units above the Fail boundary is
  .
.
3. If it is known that a student's grade is greater than , what is the probability that their grade is, in fact, greater than ?
We substitute:
From the first part of this exercise we know that the probability that a student obtains a score greater than points on the exam is .

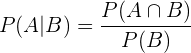
Now we will use the conditional probability formula:
We substitute:
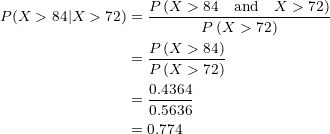
The probability that a student who obtained a score greater than actually obtained a score greater than is  .
.
After a general knowledge test, it is observed that the scores obtained follow a distribution  . We want to classify the examinees into three groups (low general knowledge, acceptable general knowledge, excellent general knowledge) so that there is
  of the population in the first,
  in the second, and
  in the third.
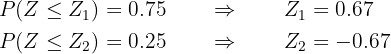
What should be the scores that mark the passage from one group to another?
We locate in our table the parameter corresponding to probability 0.2, (20%), which is  :
:

So, if  , then:
Now we locate in the table the parameter for probability  , which is
  , which means:

So, if  , then:
Low knowledge: up to  points.
Acceptable knowledge: between and .
Excellent knowledge: from points onward.
Several intelligence tests gave a score that follows a normal distribution with mean  and standard deviation
  .
.
1. Determine the percentage of the population that would obtain a coefficient between  and
and  .
.
2. What interval centered on contains  of the population?
3. In a population of  individuals, how many individuals are expected to have a coefficient greater than
  ?
?
1. Determine the percentage of the population that would obtain a coefficient between and .
Substituting values in the formula:
The percentage of the population that will obtain a score between and is  .
.
2. What interval centered on contains of the population?
Since we want to take the from the center of the population, we take the interval that is between and  .
.
We locate in the table the parameter for probabilities  and :
and :
We substitute and solve:
and
Therefore, the interval is:  .
.
The centered interval that contains of the population will obtain a score between  and .
and .
3. In a population of individuals, how many individuals are expected to have a coefficient greater than ?
We substitute values in the formula, calculate the parameter, and locate the probability in the table:
Multiplying this probability by the individuals:

In a population of individuals, it is expected that  of them have a coefficient greater than .
In a city, one out of every three families owns a telephone. If families are chosen at random, calculate the probability that among them there are at least  with a telephone.

Where:
n: Number of families to choose.
p: Probability of selecting a family that has a telephone.
q: Complement of the probability.
To solve this type of exercise we will use the De Moivre-Laplace Theorem for Probability:
If is a binomial random variable with parameters  and
and  ,
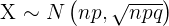
, 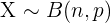 , then can be approximated to a normal distribution with mean
  and standard deviation
  (where
  ) if the following two conditions are met:
Condition 1: 
Condition 2: 
Then, the binomial variable would be approximated by the normal variable  .
.
Since  , condition 1 is met.
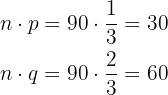
Therefore, condition 2 is met.
Then we use the formula .
We substitute the data:

Now we use the normal distribution formula:
We substitute, operate, and locate the probability value in our normal distribution table:
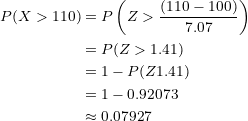
When selecting families at random, there is a probability of  of having selected at least families with a telephone.
On a multiple-choice test exam with  questions, each question has one correct answer and one incorrect answer. You pass if you answer more than correct answers. Assuming you answer at random, calculate the probability of passing the exam.
We use the De Moivre-Laplace Theorem for Probability:
We check the 2 conditions:
First condition:

Second condition:

Since both conditions are met, we will use the formula:
We substitute:

Now we will use :
When answering a multiple-choice test exam at random, there is a probability of  of passing.
A study has shown that, in a certain neighborhood,  of households have at least two televisions. A sample of households is randomly chosen in said neighborhood. Find:
1. What is the probability that at least  of the cited households have at least two televisions?
2. What is the probability that between  and
and  households have at least two televisions?
1. What is the probability that at least of the cited households have at least two televisions?
We use the De Moivre-Laplace Theorem for Probability, checking if the 2 conditions are met:

Since both conditions are met, we will use the formula .
We substitute:

Now we will use .
We substitute:
2. What is the probability that between and households have at least two televisions?
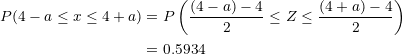
Using the formula , we will substitute the value of the mean  and the standard deviation
 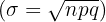 :
:
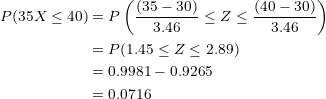
The probability that between and households have at least televisions is  .
.
Are you feeling lost and need reinforcement? Don't worry, we can help you with middle school and high school math classes and homework.
Find the best math course from all those we offer at Superprof. You can learn with either an online math teacher or an in-person one. You decide!
Summarize with AI:
Did you like this article? Rate it!