Welcome to our page dedicated to solved exercises on function graphs! If you're interested in understanding how mathematical functions can be visualized and analyzed graphically, you've come to the right place.
In this space, we will explore key concepts related to the graphical representation of linear and quadratic functions. We will provide you with a variety of practical exercises and step-by-step explanations to help you develop your skills in this fascinating field.
In these exercises you will need to graph or analyze function graphs to extract fundamental information about their behavior, a combination that will undoubtedly make you an expert in this area. Let's dive into these interesting exercises!
Graph the following lines:
1
2
3
4
5
6
7
8
9
10
1

2
3
4
5
6
7
| x | y = x |
|---|---|
| 0 | 0 |
| 1 | 1 |
8

| x | y = -2x - 1 |
|---|---|
| 0 | -1 |
| 1 | -3 |
9
| x | |
|---|---|
| 0 | -1 |
| 2 | 0 |
10
| x |  |
|---|---|
| 0 | 0 |
| 1 | 2 |
Graph the following functions, knowing that:
1) It has slope  and y-intercept
  .
.
2) It has slope  and passes through the point
  .
.
3) It passes through the points  and
and  .
.
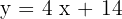
4) It passes through the point  and is parallel to the line with equation
 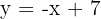 .
.
1 It has slope and y-intercept .


| x | 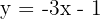 |
|---|---|
| 0 | -1 |
| 1 | -4 |
2 It has slope and passes through the point (−3, 2).


| x |  |
|---|---|
| 0 | 14 |
| 1 | 18 |
3 It passes through the points and .


| x | 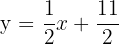 |
|---|---|
| 0 |  |
| 1 | 6 |
4 It passes through the point and is parallel to the line with equation .


| x |  |
|---|---|
| 0 | -1 |
| 1 | -2 |
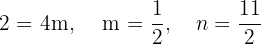
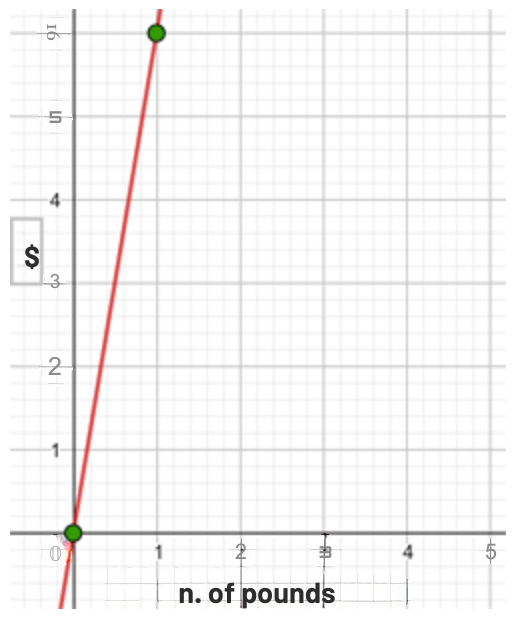
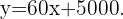
Three pounds of anchovies cost $ . Write and graph the function that defines the cost of anchovies as a function of pounds purchased.
The y-intercept is  which corresponds to the value of pounds.
The slope is 
The equation of the line is 
In the first  weeks of growing a plant, which measured
  cm (0.79 inches), it has been observed that its growth is directly proportional to time, seeing that in the first week it has grown to measure
  cm (0.98 inches). Establish a function that gives the height of the plant as a function of time and graph it
Initial height  cm (0.79") is the y-intercept
Weekly growth  is the slope
The equation of the line is 

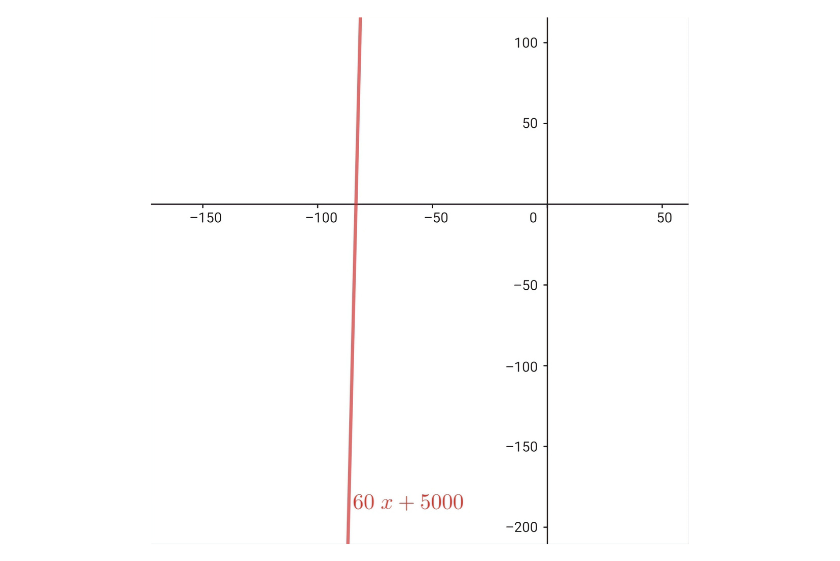
For renting a car they charge $ daily plus $
 per mile. Find the equation of the line that relates the daily cost with the number of miles and graph it. If in one day a total of
  miles has been traveled, what amount must we pay?
The y-intercept is and the slope is
The equation of the line is 
The amount to pay for traveling miles in one day is:
 $
$
An event hall offers its services in a single plan for people at a cost of $ . Additionally, the hall's policy states that if people are exceeded, they will charge $
 per extra person. Write and graph the function that defines these costs. Use this function to calculate an overage of
  people
Since we know that the plan has a cost of $ regardless of whether there are or fewer people, then we are dealing with the constant function

Now, for each extra person, the hall charges $. That is, after people, our function ceases to be constant and becomes a linear function whose slope is , which corresponds to the extra cost per person. Thus, our function, which has extra people as the independent variable, is
As we can easily verify, $ , which corresponds to people and
 $ which corresponds to the total cost for an overage of people.
A beach house, with availability for  people, has a cost per night of $
 . Additionally, a reservation of a minimum of
  nights is required with an open option to rent the property more nights at a cost of $
 each. Write and graph the function that models this situation. A group of friends decides to rent the property and wishes to extend their stay more nights. How much should they pay in total?
The minimum number of nights required when renting the property is . If each night has a cost of $, the total for the reservation of is $ . This can be modeled with the constant function

Each extra night has a cost of $. To incorporate this factor, we must move to a linear function.
The linear function  models our problem. Here the independent variable
  corresponds to the number of extra nights.
If the group of friends decides to extend their stay in the house nights, then this corresponds to
 $ as the total cost for the
  nights.
Find the vertex and the equation of the axis of symmetry of the following parabolas:
1
2
3
4
5
6
1
Vertex 
Axis of symmetry 
2
Vertex
Axis of symmetry
3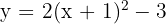
Vertex 
Axis of symmetry 
4
Vertex 
Axis of symmetry 
5
Vertex 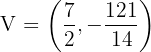
Axis of symmetry 
6
Vertex 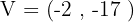
Axis of symmetry 
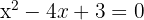
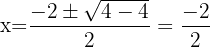
Indicate, without graphing them, at how many points the following parabolas intersect the x-axis:
1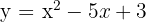
2
3
4
1

Two intersection points
2

No intersection points
3 

One intersection point
4

Two intersection points
Graph the quadratic functions:
1
2
1
We calculate the coordinates of the vertex

We find the intersection points with the  axis
axis

We find the intersection point with the  axis
axis

2
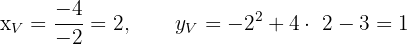
We calculate the coordinates of the vertex


We find the intersection points with the axis

Coincides with the vertex: 
We find the intersection point with the axis

A quadratic function has an expression of the form  and passes through the point
  . Calculate the value of
We substitute the point into the function

It is known that the quadratic function with equation  passes through the points
  and
and  . Calculate
  and
and 
We substitute the value of each point into


We solve the system by elimination


The quadratic function is: 
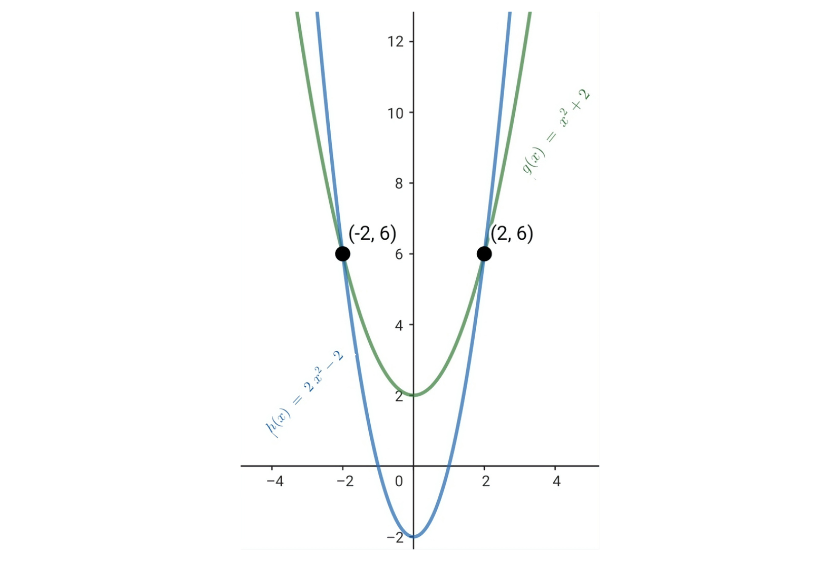
Consider the quadratic functions 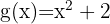 and
and  . Calculate their intersection points
To find the intersection points of these quadratic functions we must equate both functions. Thus we have that

Now, we substitute these values of  into either of the quadratic functions:

Therefore, the intersection points of the quadratic functions are:

Summarize with AI:
Did you like this article? Rate it!