In this article, we will explore a series of solved exercises that demonstrate how to work with linear functions. We will address different aspects, such as identifying slope and intercept, graphical representation, and solving practical problems.
Graph the indicated functions and solve the following problems
y = 2
Graph the constant function:
y = 2
This function refers to all points with coordinates (x,y) where y = 2, that is, all points (x,2), where x is an independent variable that can be assigned any value, for example (1,2), (-4,2), (5,2), etc.
y = –2
Graph the constant function:
y = −2
This function refers to all points with coordinates (x,y) where y = -2, that is, all points (x,-2), where x is an independent variable that can be assigned any value, for example (1,-2), (-4,-2), (5,-2), etc.

Graph the constant function:
This function refers to all points with coordinates (x,y) where , that is, all points  , where x is an independent variable that can be assigned any value, for example:
y = 0
Graph the constant function:
y = 0
This function refers to all points with coordinates (x,y) where y = 0, that is, all points (x,0), where x is an independent variable that can be assigned any value, for example (1,0), (-4,0), (5,0), etc.
x = 0
Graph the vertical line
x = 0
This is not a function and refers to all points with coordinates (x,y) where x = 0, that is, all points (0,y), where y is an independent variable that can be assigned any value, for example (0,1), (0,-3), (0,5), etc.
x = −5
Graph the vertical line
x = −5
This is not a function and refers to all points with coordinates (x,y) where x = -5, that is, all points (-5,y), where y is an independent variable that can be assigned any value, for example (-5,1), (-5,-3), (-5,5), etc.
y = x
Graph the function:
y = x
This function refers to all points with coordinates (x,y) where y = x, that is, all points (x,y), where x is an independent variable that can be assigned any value, for example (1,1), (-3,-3), (5,5), etc.
To graph efficiently, we create a table where we place the x-values on the left (any values we choose) and the y-values on the right, after evaluating the assigned x-value in our function.

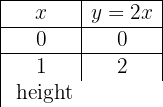
y = 2x
Graph the linear function:
y = 2x
To graph efficiently, we create a table where we place the x-values on the left (any values we choose) and the y-values on the right, after evaluating the assigned x-value in our function.
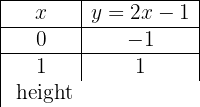
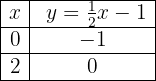
y = 2x − 1
Graph the affine function:
y = 2x − 1
To graph efficiently, we create a table where we place the x-values on the left (any values we choose) and the y-values on the right, after evaluating the assigned x-value in our function.
y = −2x − 1
Graph the affine function:
y = −2x − 1
To graph efficiently, we create a table where we place the x-values on the left (any values we choose) and the y-values on the right, after evaluating the assigned x-value in our function.

Graph the affine function: 
Graph the affine function:

To graph efficiently, we create a table where we place the x-values on the left (any values we choose) and the y-values on the right, after evaluating the assigned x-value in our function.
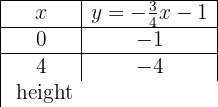
Graph the affine function:
To graph efficiently, we create a table where we place the x-values on the left (any values we choose) and the y-values on the right, after evaluating the assigned x-value in our function.
Graph the following function, knowing that it has slope −3 and y-intercept −1
y = -3x -1

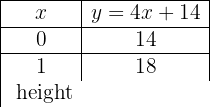
Graph the following function, knowing that it has slope 4 and passes through the point (−3, 2)
The function is: y = mx + n
m = 4, we substitute the value of m: y = 4x + n
One point is (−3, 2), we substitute the point values: 2 = 4 · (−3) + n n = 14
y = 4 x + 14
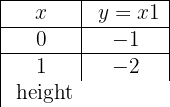
Graph the following function, knowing that it passes through points A(−1, 5) and B(3, 7)
The function is: y = mx + n
Passes through (−1, 5): 5 = −m + n
Passes through (3, 7) : 7 = 3m + n
We solve the system by elimination
−5 = m − n
7 = 3m + n
2 = 4m  m = ½ n = 11/2
The function is: 

Graph the following function, knowing that it passes through point P(2, −3) and is parallel to the line with equation y = −x + 7
The function is: y = mx + n
Two parallel lines have the same slope, m = –1
Passes through (2, −3):−3 = −1 · 2 + n n = − 1
The function is: y = −x − 1
During the first 10 weeks of growing a plant that initially measured 0.79 inches, it has been observed that its growth is directly proportional to time, noting that in the first week it grew to measure 0.98 inches. Establish an affine function that gives the height of the plant as a function of time and represent it graphically
Initial height = 0.79 inches
Weekly growth = 0.98 − 0.79 = 0.19 inches
y = 0.19 x + 0.79
For car rental, they charge $100 daily plus $0.30 per mile. Find the equation of the line that relates the daily cost to the number of miles and create the graph. If 186 miles were driven in one day, what amount should we pay?
y = 0.3 x + 100
y = 0.3 · 300 + 100 = $190
Calculate the coefficients of the function: f(x) = ax + b if f(0) = 3 and f(1) = 4
f(0) = 3
3 = a · 0 + b b = 3
f(1) = 4
4 = a · 1 + b a = 1
f(x) = x + 3
Calculate the coefficients of the function:  , si
, si  y
y 


Summarize with AI:
Did you like this article? Rate it!