


What Is the Arithmetic Mean of a Number?
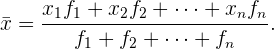
In mathematics, the arithmetic mean of a list of real numbers is the sum of the values divided by the number of values. For example, if we want to know the average grade that students in a class have received, we first add up all their grades and then divide by the number of students in the class.
Solved Arithmetic Mean Exercises
Consider the following data:  .
.
a) Calculate its mean.
b) If we multiply all the previous data by  , what will the new mean be?
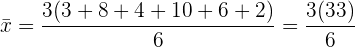
a) The mean  of a data set is given by the sum of the data divided by the total number of data points. Thus:

b)

We observe that if all the data is multiplied by , then the arithmetic mean is also multiplied by . Therefore, it is possible to represent this observation in the following property satisfied by the arithmetic mean:

with  a constant.
To a set of  numbers whose mean is
  , the numbers
  and
and  are added. What is the mean of the new set of numbers?
We know from the start that:
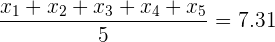
Now, let's calculate the mean of the set of seven numbers and develop as follows:
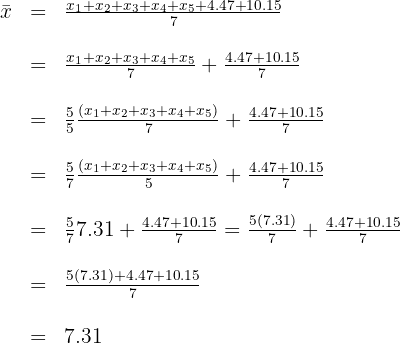
Thus, the mean remains the same.
Calculate the mean of a statistical distribution given by the following table:
 | 61 | 64 | 67 | 70 | 73 |
 | 5 | 18 | 42 | 27 | 8 |
The table shows the variable  and the number of times it repeats in the data set
  . For this reason, we must complete the table with the product of the variable times its absolute frequency
  in order to have the sum of all values that repeast times, and thus be able to finally add all of them and divide by the amount of data generated. Observe the formula:
Here is the numerical development:
| |  |
| 61 | 5 | 305 |
| 64 | 18 | 1152 |
| 67 | 42 | 2814 |
| 70 | 27 | 1890 |
| 73 | 8 | 584 |
| 100 | 6745 |
Then we just need to perform the division:

Reaching the desired result.
Find the mean of the statistical distribution given by the following table:
| Interval | |
| [10, 15) | 3 |
| [15, 20) | 5 |
| [20, 25) | 7 |
| [25, 30) | 4 |
| [30, 35) | 2 |
First of all, notice that now the data is not represented in the same way as before; we have intervals of values. In this case, what we do is calculate something called the class mark  . This consists of finding the mean between the two values that defines the interval, for example:
and so on with the other intervals.
Once the calculation is done, we complete the table with the product of the variable times its absolute frequency  to calculate the mean:
| Interval | | | |
| [10, 15) | 12.5 | 3 | 37.5 |
| [15, 20) | 17.5 | 5 | 87.5 |
| [20, 25) | 22.5 | 7 | 157.5 |
| [25, 30) | 27.5 | 4 | 110 |
| [30, 35) | 32.5 | 2 | 65 |
| 21 | 457.5 |
We calculate the sum of the variable times its absolute frequency  which is
  and divide it by the total number of data points
  which is
  . Thus:
The results of throwing a die  times are given by the following table:
| 1 | 2 | 3 | 4 | 5 | 6 |
| | 32 | 35 | 33 |  | 35 |
Determine  and
and  knowing that the average score is
  .
.
From the given data we can construct the following table:
| | |
| 1 | | |
| 2 | 32 | 64 |
| 3 | 35 | 105 |
| 4 | 33 | 132 |
| 5 | |  |
| 6 | 35 | 210 |
 |  |
The sum of the data in column gives us:

We set this equal to 200, which is one of the problem's conditions. Thus:
Simplifying we obtain our first equation:

Now we calculate the mean of the distribution and set it equal to 3.6, which is the value indicated in the problem:
Again simplifying we obtain our second equation:

Therefore we have the following system of equations:

We solve it by the elimination method:

Therefore:

Thus we conclude that:
 and
and 
Calculate the mean of the statistical distribution:
| Interval | |
| [0, 5) | 3 |
| [5, 10) | 5 |
| [10, 15) | 7 |
| [15, 20) | 8 |
| [20, 25) | 2 |
| [25, ∞) | 6 |
We begin by calculating the  :
:
| Interval | | |
| [0, 5) | 2.5 | 3 |
| [5, 10) | 7.5 | 5 |
| [10, 15) | 12.5 | 7 |
| [15, 20) | 17.5 | 8 |
| [20, 25) | 22.5 | 2 |
| [25, ∞) | --- | 6 |
| 31 |
And here we observe that the mean CANNOT be calculated because we cannot find the class mark of the last interval.
Consider the following data:  .
.
a) Calculate its mean.
b) If we add 6 to all the previous data, what will the new mean be?
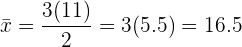
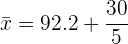
a) The mean of a data set is given by the sum of the data divided by the total number of data points. Thus:

b)


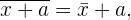
We observe that if we add  to all the data, then the arithmetic mean also increases by . Therefore, it is possible to represent this observation in the following property satisfied by the arithmetic mean:
with a constant.
The heights in inches of the  players who started a volleyball game, separated by team, are as follows:
Team 1: 
Team 2: 
a) Calculate the mean of each team.
b) Calculate the mean for the game.
a)
Team 1:

Team 2:

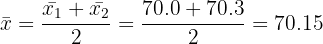
b)
To calculate the mean for the game, , we calculate the mean of the means  and
and  . Thus:
The mean of a set of numbers is  . If
. If  data points are added, one of which is
  , what value must the second data point have for the mean to remain the same?
For the mean of the data set to remain the same, the two added data points must satisfy that their mean equals . We know that one of them is . Let's call the second data point "". Therefore, what we seek is:

We solve this first-degree equation:

Thus, the second data point must be  . As we can easily verify, the mean remains :

Calculate the mean of the first  multiples of
  . Generalize the previous result to calculate the mean of the first
  multiples of .
The first multiples of are:

Thus, their mean is:

To generalize the previous result, note that the n-th multiple of is  . Thus, the mean is:
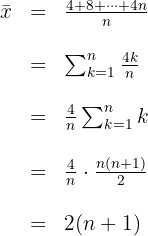
Taking the value  in the expression above, we obtain the result from the first part of the exercise.
Summarize with AI:
Did you like this article? Rate it!