
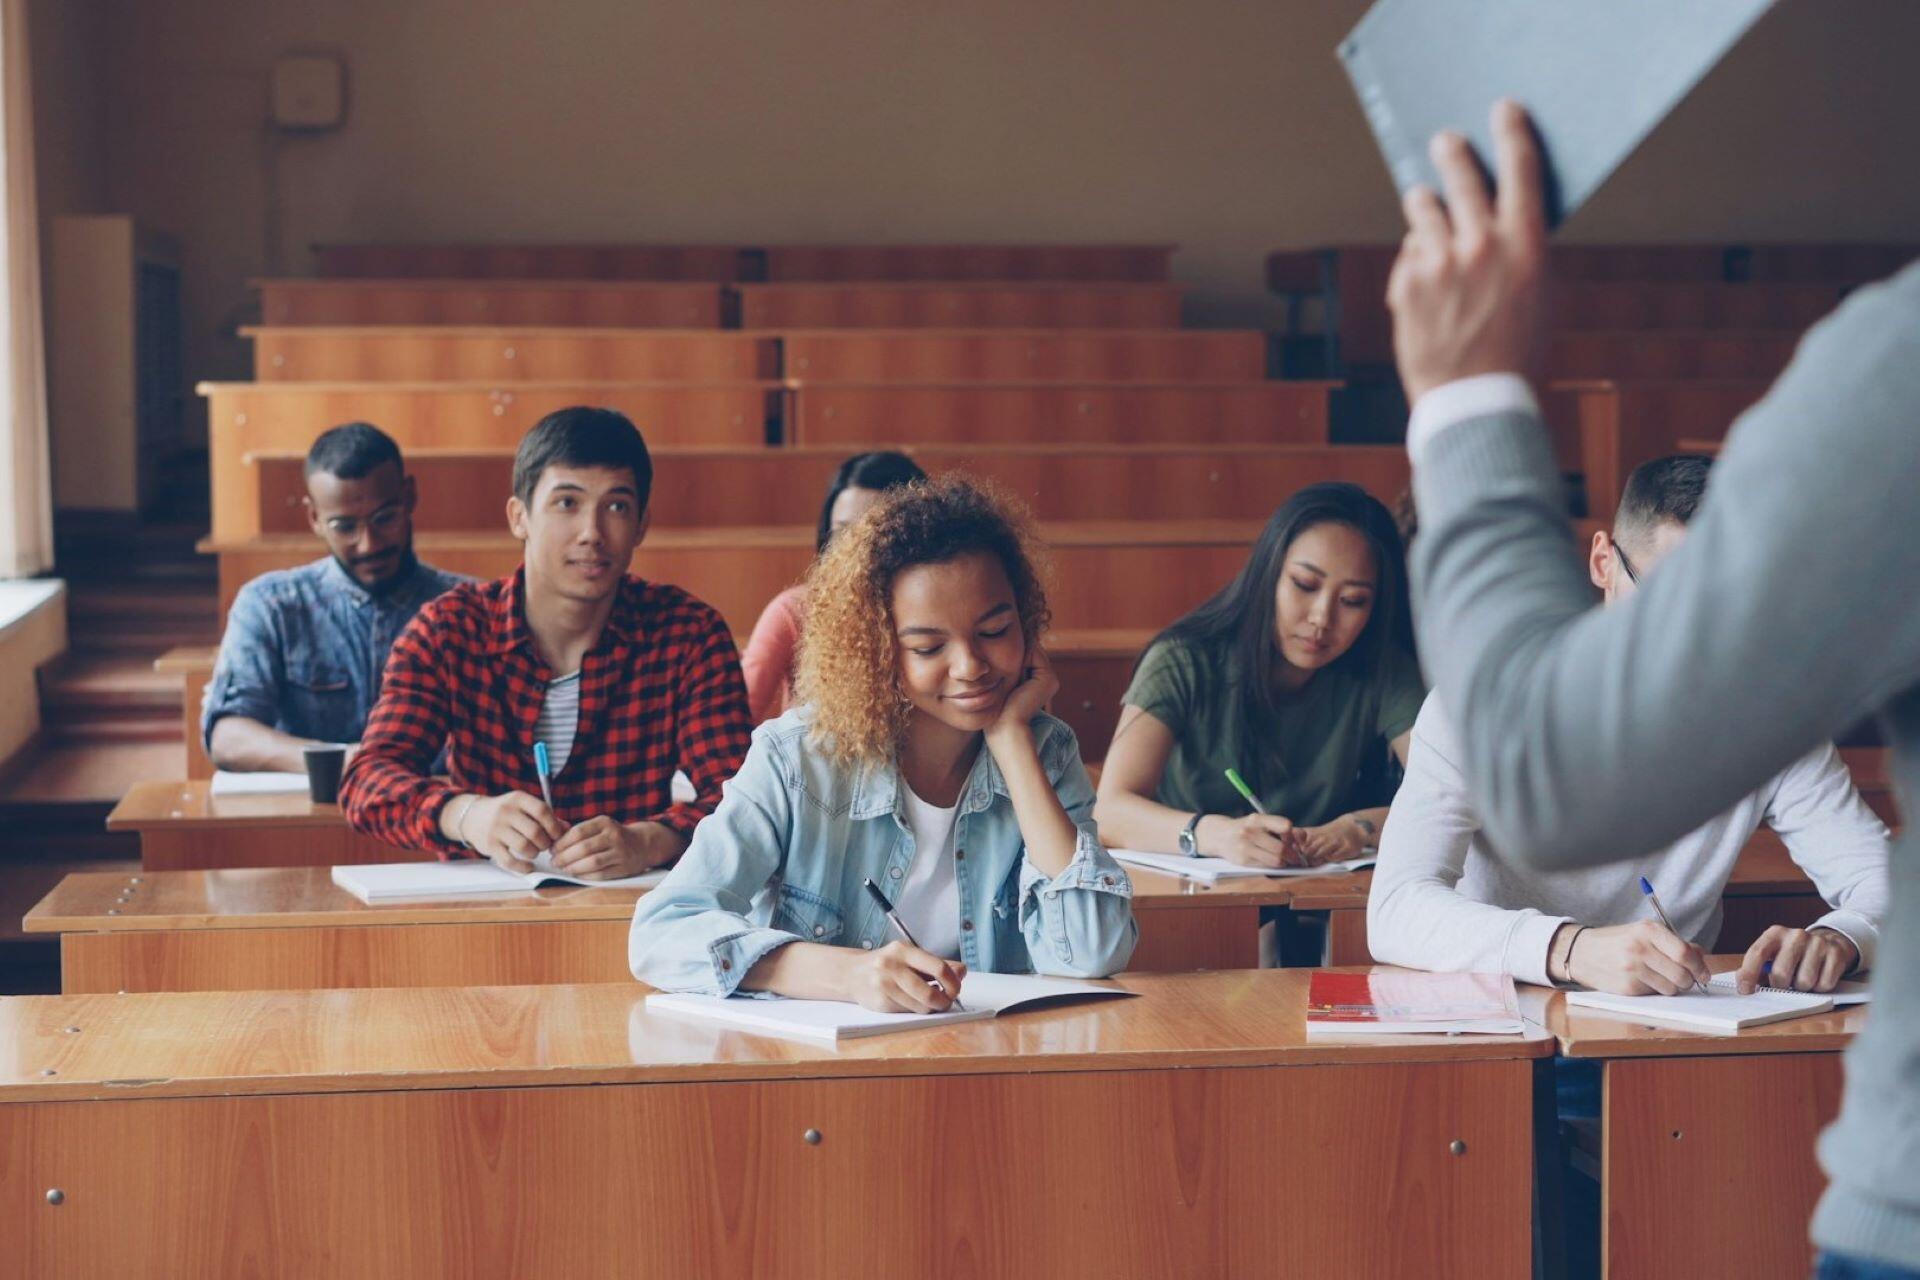

Generally, a statistics class should teach you how to collect, organize, interpret, analyze, and communicate data so you can answer questions using evidence. You don't just learn formulas, though; you could decide whether a survey sample is representative, compare two groups, estimate a population value from sample results, or judge whether an apparent pattern could be due to chance. For college statistics classes, you typically use datasets with problems drawn from real situations, and your job is to work out what the numbers mean and how to calculate them.⁵
Key Takeaways
- Introductory statistics covers data collection, descriptive statistics, probability, distributions, statistical inference, correlation, and regression.
- College statistics classes can include lectures, problem sets, data labs, quizzes, tests, projects, and software-based analysis, depending on the course.
- Statistics is not only about calculations. Students learn to interpret uncertainty, evaluate evidence, recognize limitations, and justify conclusions.
- Course content and assessment methods vary between colleges, so students should check their syllabus for the exact topics, software, and grading structure.
Collect and Organize Data
Learn how samples are selected, variables are defined, and raw data are summarized using tables, graphs, and numerical measures.⁵
Analyze and Interpret Data
Use probability, distributions, confidence intervals, and hypothesis tests to understand patterns, differences, and uncertainty.³
Find Relationships and Communicate Results
Examine relationships using methods such as correlation and regression, then explain what the evidence does and does not support.⁷


What Is a Statistics Class?
Basically, a statistics class teaches you reasoning based on data and prepares you for some careers using statistics. You're not just asked to calculate a value; you have to learn to consider whether data were gathered appropriately, what a result says about the question being investigated, and how confident your conclusion is. In your basic introductory classes, you'll build concepts around real or realistic data, using calculations that support interpretation, not replace it.²
Data collection, descriptive statistics, probability, distributions, statistical inference, correlation, and regression.⁵
Working with data, choosing suitable statistical methods, using technology, interpreting results, solving problems, and communicating findings clearly.¹
Introductory statistics is taught to students from many different fields and is often designed for students outside mathematics and engineering.⁵
The goal is to develop statistical thinking so students can investigate questions, work with real data, and make evidence-based decisions rather than memorize formulas.²
What Do You Learn in a Statistics Class?
In your first statistics classes, don't be surprised if they teach you how to understand data. Some students worry that statistics is a challenging subject, but like every subject, you will find challenging topics, especially if they're completely new to you. You'll be taught how to make carefully qualified conclusions beyond said data, with each stage adding a different way to describe variation, compare outcomes, or evaluate evidence.
Data Types and Ways to Collect Data
A population is the complete group you want to learn about, while a sample is the smaller group actually studied. A parameter describes a population, whereas a statistic is calculated from a sample and can be used to learn about the wider population.⁴
Descriptive Statistics
Probability and Randomness
Probability gives you a way to reason about randomness and uncertainty. Once students understand probability and probability distributions, introductory courses can move into inferential methods that use sample data to draw conclusions about populations.⁴
Distributions

Inferential Statistics
| Type | What it does | Common examples |
|---|---|---|
| Descriptive statistics | Organizes and summarizes the data you have | Graphs, mean, median, quartiles, range, variance, standard deviation |
| Inferential statistics | Uses sample data to estimate, test, or draw conclusions about a population | Confidence intervals, hypothesis tests, p-values, comparisons between groups |
Relationships Between Variables
Finding an association between two variables does not automatically show that one causes the other. Study design, confounding factors, and potential bias all matter when deciding what conclusions the evidence can support.¹
What Does a College Statistics Class Consist of?
In practice, the exact format of your college statistics class will depend on your school, the instructor, and the level. Expect regular work outside of your main class, though. Typically, courses combine instructor-led explanations with problem-solving, short assessments, computer-based analysis, and larger tests. Work may include explaining a statistical output in plain English, justifying why a particular technique is suitable, or identifying weaknesses in study design. It may all feel new to you if you didn't study AP Statistics.

Penn State's STAT 200 uses StatKey and Minitab Express.⁶ Berkeley's Stat 20 uses R and the tidyverse, so students should check their own syllabus rather than assume every statistics course uses the same tools.⁸
| Component | What it may involve | What it helps students practice |
|---|---|---|
| Class sessions | Lectures, worked examples, discussion, problem-solving, or flipped/active-learning activities | Understanding concepts and choosing appropriate methods |
| Homework and problem sets | Regular questions involving calculations, graphs, probability, and interpretation | Practice, retention, and applying methods independently |
| Labs and data analysis | Working with real datasets using calculators, spreadsheets, or statistical software | Applying methods, using technology, and interpreting output |
| Quizzes and midterms | Shorter or unit-based assessments during the course | Checking understanding of recent topics and procedures |
| Final exam | A broader assessment of course material; whether it is cumulative depends on the course | Combining concepts, calculations, and interpretation |
| Projects or portfolios | Data investigations, reports, or computational work in courses that use them | Analysis, problem-solving, and communicating statistical findings |
What Does Statistics Teach Students?
Statistics will teach you how to judge evidence, without making data appear more certain than they are. At the best schools for statistics, you'll separate what the results demonstrate from what they suggest, recognize limitations, and decide how much confidence a particular conclusion deserves.¹ This reasoning is useful beyond your statistics tests, with statistical literacy being key when you ask where figures came from, what information may be missing, and whether the conclusion being presented is actually supported by the available evidence.²
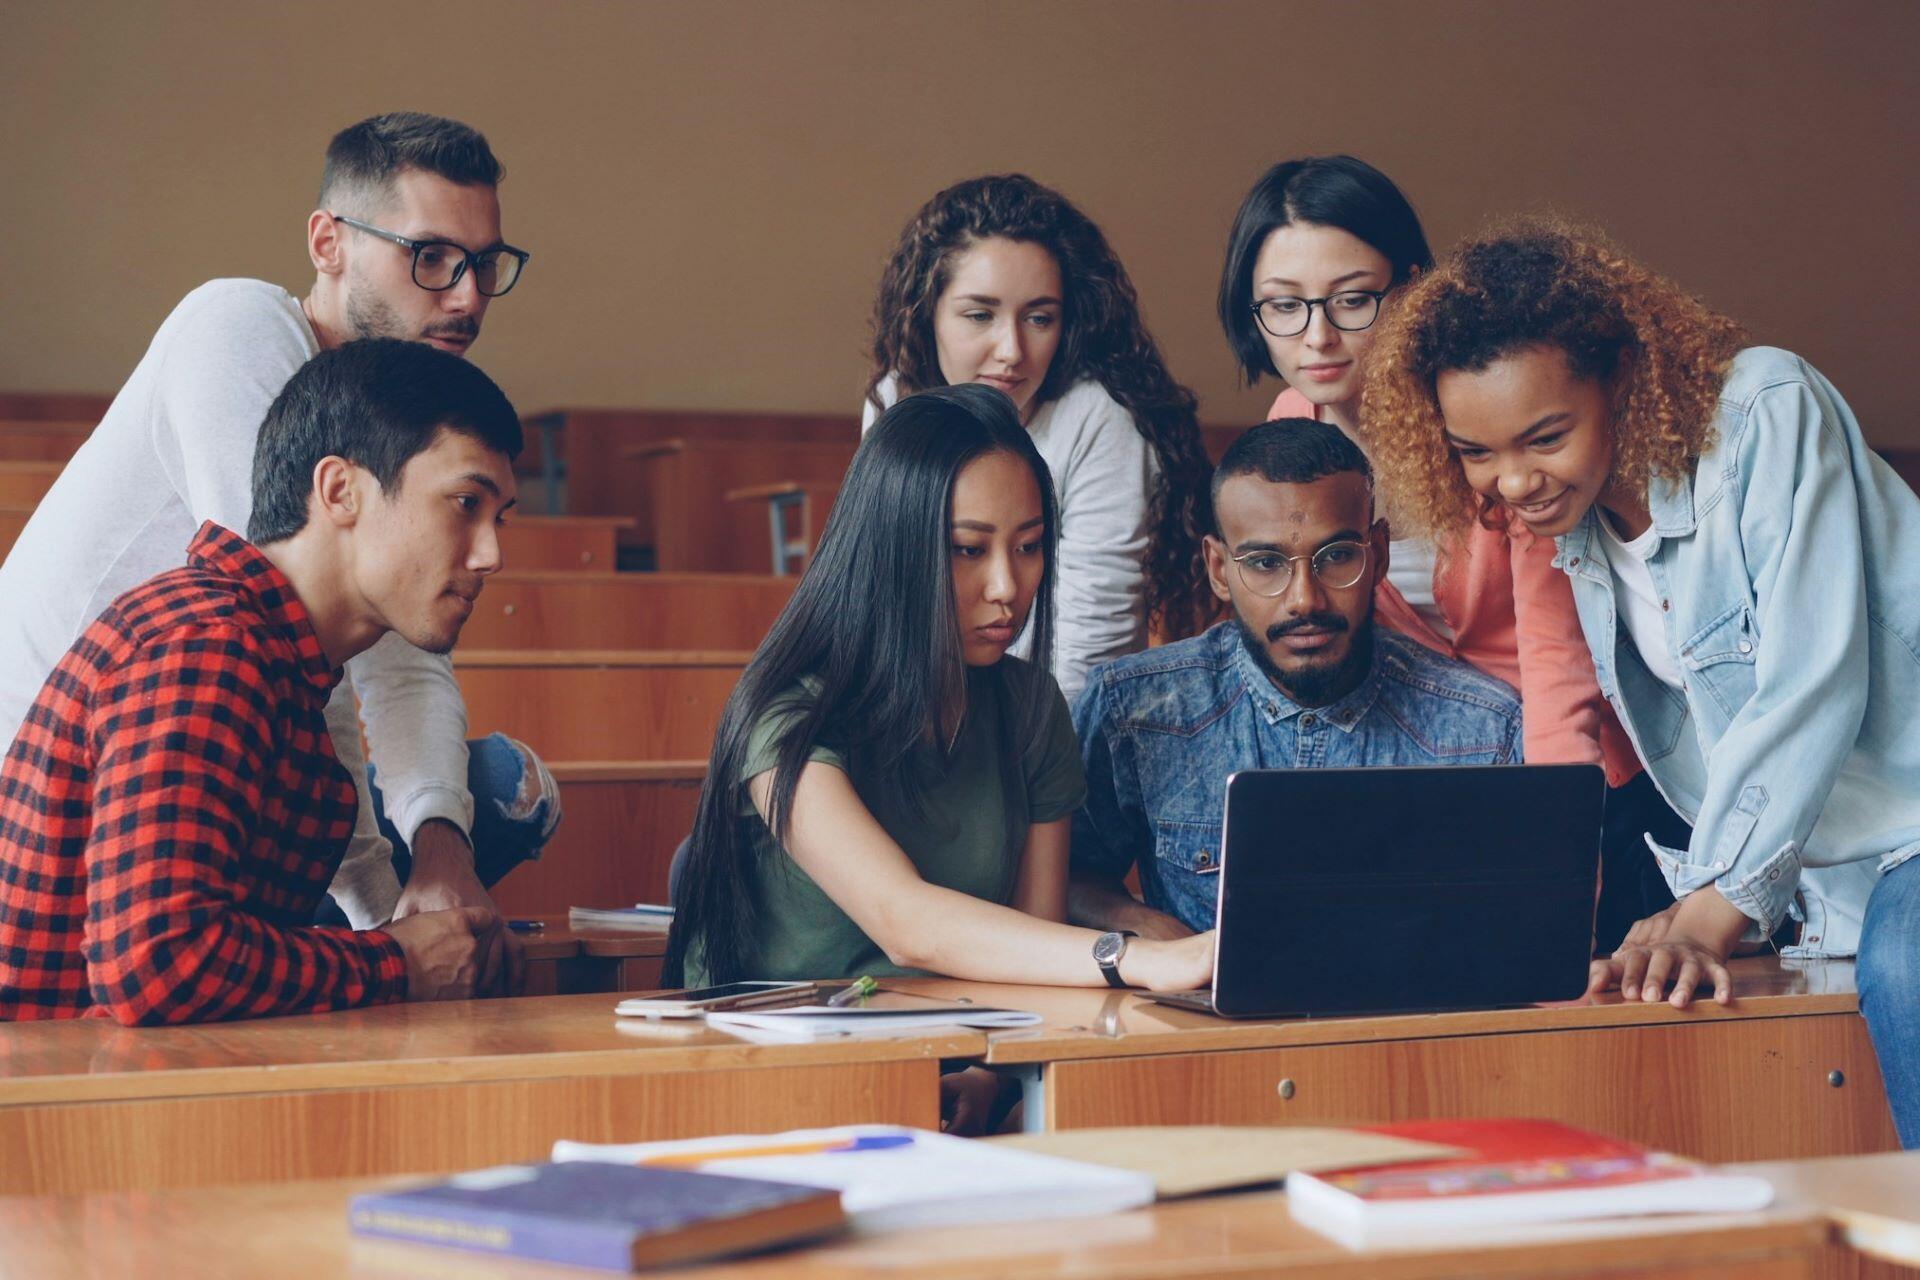
Statistics is an investigative process, not simply a collection of formulas.
Students learn to start with a question, gather suitable data, select an appropriate analysis, interpret the uncertainty in the result, and communicate a conclusion that matches the evidence.²
References
- American Statistical Association. “Curriculum Guidelines for Undergraduate Programs in Statistical Science.” American Statistical Association, https://www.amstat.org/education/curriculum-guidelines-for-undergraduate-programs-in-statistical-science-. Accessed 2 Sept. 2026.
- American Statistical Association. “Guidelines for Assessment and Instruction in Statistics Education (GAISE) Reports.” American Statistical Association, https://www.amstat.org/education/guidelines-for-assessment-and-instruction-in-statistics-education-%28gaise%29-reports. Accessed 2 Sept. 2026.
- College Board. “AP Statistics Course.” AP Central, https://apcentral.collegeboard.org/courses/ap-statistics. Accessed 2 Sept. 2026.
- OpenStax. “1.1 Definitions of Statistics, Probability, and Key Terms.” Statistics, Rice University, https://openstax.org/books/statistics/pages/1-1-definitions-of-statistics-probability-and-key-terms. Accessed 2 Sept. 2026.
- OpenStax. “Preface.” Introductory Statistics 2e, Rice University, https://openstax.org/books/introductory-statistics-2e/pages/preface. Accessed 2 Sept. 2026.
- Pennsylvania State University. “STAT 200: Elementary Statistics.” STAT ONLINE, https://online.stat.psu.edu/statprogram/stat200. Accessed 2 Sept. 2026.
- Pennsylvania State University. “STAT 200 | Elementary Statistics.” STAT ONLINE, https://online.stat.psu.edu/stat200/index. Accessed 2 Sept. 2026.
- University of California, Berkeley. “Syllabus: Stat 20, Introduction to Probability and Statistics.” Department of Statistics, https://stat20.berkeley.edu/summer-2026/syllabus.html. Accessed 2 Sept. 2026.
Summarize with AI:
Did you like this article? Leave a rating!

 Loading...

