In statistics, quartiles are values that divide an ordered set of data into four equal parts, allowing for more detailed analysis of data distribution. Quartiles provide an important measure of dispersion and are fundamental in describing variability within a dataset.
In this set of solved exercises, we will address step by step how to calculate and analyze quartiles from a dataset, providing practical examples that illustrate both calculation methods and their interpretation in statistical contexts. These exercises will help strengthen your understanding of data analysis techniques and develop key skills for interpreting data distribution and dispersion.


Calculating Quartiles from a Data Set
Calculate the quartiles of the set 
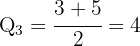
Let's begin by arranging the set in ascending order: 2, 3, 4, 5, 6, 7, 9
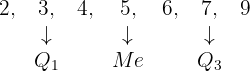
Calculate the quartiles of the set: 
Let's begin by arranging the set in ascending order: 2, 4, 5, 6, 7, 9
For  :
: 
For  :
: 
For  :
: 
Calculate the quartiles of the set: 
Let's begin by arranging the set in ascending order: 2, 3, 4, 5, 9
For : 
For : 
For : 
Calculate the quartiles of the set: 
Let's begin by arranging the set in ascending order: 1, 2, 3, 4, 5, 6, 7, 9
For : 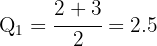
For : 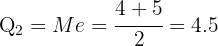
For : 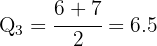
Calculate the quartiles of the set: 
Ordered set: 3, 4, 4, 5, 6, 7, 7, 8, 8, 9, 9, 10, 10, 10, 10, 11, 12, 13, 13, 14, 16, 16, 17, 18, 18, 20
For : 
For : 
For : 
Calculating Quartiles Using Different Tables
Calculate the quartile from the following table:
| xi | fi |
|---|---|
| 50 | 3 |
| 51 | 1 |
| 53 | 2 |
| 57 | 1 |
| 59 | 5 |
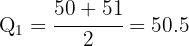
We look for the position where the first quartile is located:

Thus, the first quartile is:
Calculate the quartile from the following table:
| xi | fi |
|---|---|
| 25 | 4 |
| 30 | 3 |
| 35 | 2 |
| 40 | 2 |
| 45 | 5 |
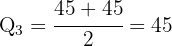
We look for the position where the third quartile is located:

Thus, the third quartile is:
Calculate the quartile from the following table:
| xi | fi |
|---|---|
| 5 | 1 |
| 7 | 2 |
| 8 | 1 |
| 10 | 3 |
| 15 | 1 |
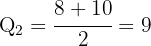
We look for the position where the second quartile is located:

Thus, the second quartile is:
Calculate the quartiles and from the following table:
| Class Interval | fi |
|---|---|
| [10, 15) | 3 |
| [15, 20) | 5 |
| [20, 25) | 7 |
| [25, 30) | 4 |
| [30, 35) | 2 |
Calculating Q₁:
We look for the interval where the first quartile is located, multiplying 1 by  and dividing by 4:
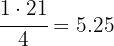
We search in the cumulative frequency column for the interval containing 5.25.
The class for is: [15, 20)
We apply the formula for calculating quartiles for grouped data:


Calculating Q₃:
We look for the interval where the third quartile is located, multiplying 3 by and dividing by 4:
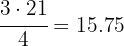
We search in the cumulative frequency column for the interval containing 15.75.
The class for is: [25, 30)
We apply the formula for calculating quartiles for grouped data:


Given the statistical distribution:
| Class Interval | fi |
|---|---|
| [0, 5) | 3 |
| [5, 10) | 5 |
| [10, 15) | 7 |
| [15, 20) | 8 |
| [20, 25) | 2 |
| [25, 30) | 6 |
Calculate the quartiles and .
We expand the table with another column showing cumulative frequency  :
:
| Class Interval | xi | fi | Fi |
|---|---|---|---|
| [0, 5) | 2.5 | 3 | 3 |
| [5, 10) | 7.5 | 5 | 8 |
| [10, 15) | 12.5 | 7 | 15 |
| [15, 20) | 17.5 | 8 | 23 |
| [20, 25) | 22.5 | 2 | 25 |
| [25, 30) | — | 6 | 31 |
| Total | 31 | ||
Calculating Q₁:
We look for the interval where the first quartile is located, multiplying 1 by  and dividing by 4:
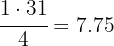
We search in the cumulative frequency column for the interval containing 7.75.
The class for is: [5, 10)
Applying the formula for grouped data:


Calculating Q₃:
We look for the interval where the third quartile is located, multiplying 3 by and dividing by 4:
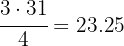
We search in the cumulative frequency column for the interval containing 23.25.
The class for is: [20, 25)
Applying the formula for grouped data:


Statistical Distribution Problem
The number of days students at a school were absent due to various illnesses is shown in the following table:
| Days Absent | fi |
|---|---|
| 0 | 10 |
| 1 | 2 |
| 2 | 5 |
| 3 | 1 |
| 4 | 2 |
| 5 | 8 |
From what value does the 25% of students with the highest number of absences begin?
Calculating the third quartile:
We look for the position where the third quartile is located, multiplying 3 by  and dividing by 4:

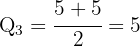
We search in the absolute frequency column for position 21:
The number of days a courier company takes to deliver 16 packages is shown in the following table:
| Days | fi |
|---|---|
| 1 | 3 |
| 2 | 3 |
| 3 | 6 |
| 5 | 1 |
| 6 | 2 |
| 7 | 1 |
From what value does the 25% of late deliveries begin?
Calculating the third quartile:
We look for the position where the third quartile is located, multiplying 3 by  and dividing by 4:
We search in the absolute frequency column for position 12:
The heights of a group of students at a school are as follows:
| Height (feet) | fi |
|---|---|
| 4'1" | 5 |
| 4'2" | 7 |
| 4'2.5" | 3 |
| 4'3" | 1 |
| 4'3.2" | 2 |
| 4'3.4" | 2 |
From what value does the 25% of tallest students begin?
Calculating the third quartile:
We look for the position where the third quartile is located, multiplying 3 by  and dividing by 4:

We search in the absolute frequency column for position 15:

The temperature in a region throughout a year is shown below:
| Temperature (°F) | fi |
|---|---|
| [32, 41) | 3 |
| [41, 50) | 5 |
| [50, 59) | 7 |
| [59, 68) | 8 |
| [68, 77) | 2 |
| [77, 86) | 6 |
Until what value does the 25% of lowest temperatures occur?
We expand the table with another column showing cumulative frequency:
| Temperature (°F) | xi | fi | Fi |
|---|---|---|---|
| [32, 41) | 36.5 | 3 | 3 |
| [41, 50) | 45.5 | 5 | 8 |
| [50, 59) | 54.5 | 7 | 15 |
| [59, 68) | 63.5 | 8 | 23 |
| [68, 77) | 72.5 | 2 | 25 |
| [77, 86) | — | 6 | 31 |
| Total | 31 | ||
Calculating Q₁: We look for the interval where the first quartile is located, multiplying 1 by and dividing by 4:
We search in the cumulative frequency column for the interval containing 7.75.
The class for is: [41, 50)
Applying the formula for grouped data:


The histogram of the distribution corresponding to the weight of 100 high school students is shown below:
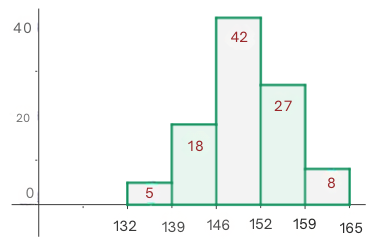
From what value does the 25% of heaviest students begin?
We construct the table from the histogram data:
| Weight (lbs) | xi | fi | Fi |
|---|---|---|---|
| [130, 140) | 135 | 5 | 5 |
| [140, 150) | 145 | 18 | 23 |
| [150, 160) | 155 | 42 | 65 |
| [160, 170) | 165 | 27 | 92 |
| [170, 180) | 175 | 8 | 100 |
| Total | 100 | ||
We look for the interval where the third quartile is located, multiplying 3 by  and dividing by 4:
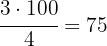
We search in the cumulative frequency column for the interval containing 75.
The class for is: [160, 170)
Applying the formula for grouped data:


Therefore, from 163.7 lbs onward, the 25% of heaviest students are found.
Summarize with AI:
Did you like this article? Rate it!

 Loading...